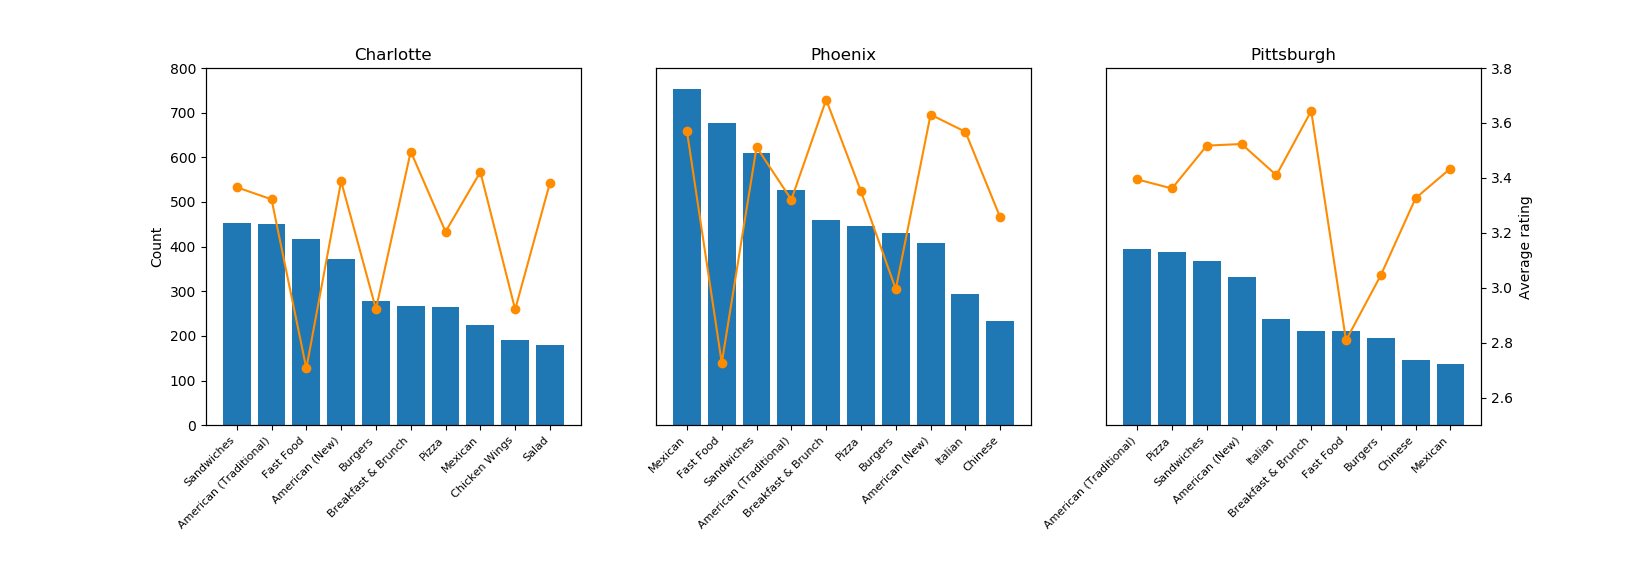
The Number of Yelp Restaurant Reviews and Average Star Rating By Categories, a Comparison of Three Cities in US
The plot reflects the popularity of restaurant categories in the three big cities of the Unities States. Three cities share a lot of common restaurant types with overall similar ten highest counted categories. But slight difference is also observed in the types and the orders of the categories. As it shows in the plot, sandwiches, American (Traditional), American (New), Fast Food, Burgers, Breakfast & Brunch, Mexican, and pizza appeared in top counted categories in all three cities. However, Chicken wings and salad are only in the top counted categories of Charlotte. Instead, Italian and Chinese are in the top categories in Phoenix and Pittsburgh. Sandwiches seems the most popular category in all three cities, since it appears in the top three in all cities. Also, restaurants with sandwiches in their categories received above average rating, indicating people are easily satisfied by the quality of sandwiches. Mexican is the highest counted in Phoenix, probably because it is highly Mexican culture influenced. As close to the Midwest, Pittsburgh enjoys the American (traditional) restaurants the most. Among all the categories, I observed that Fast food restaurants received the lowest average rating for three cities, but Breakfast and Brunch is the highest rated category. Perhaps, people always complained the quality of fast food because it is usually made with low-cost ingredients. On the other way, people are easily entertained by breakfast and brunch.
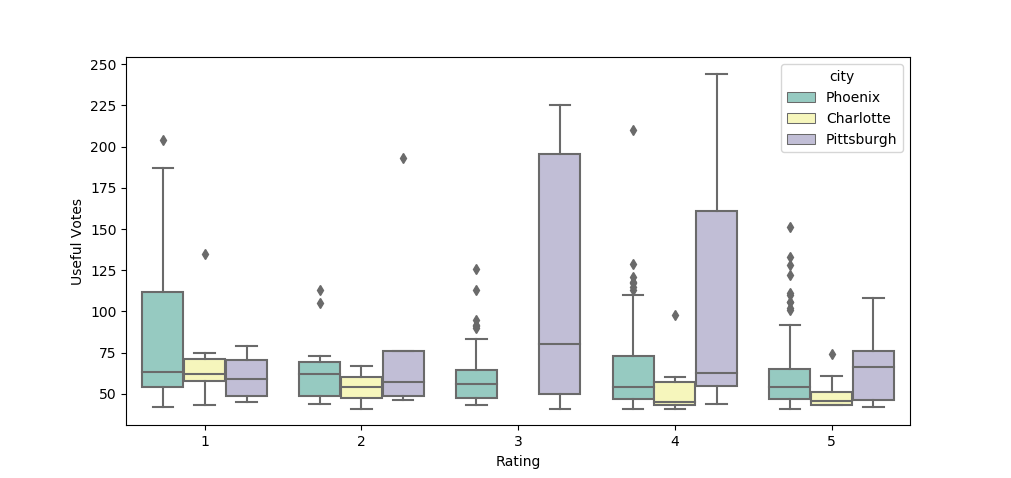
The Number of Useful Votes against the Review Rating, a Comparison of Three Cities in the US
I did not detect strong pattern between the rating of the reviews and the numbers of useful votes the reviews received from other users. Except for Charlotte, the medians of the number of votes shows negative relationship to the rating of the reviews. However, there is no reviews of rating 3 with useful votes over 40. So it is hard to tell if majority of people in Charlotte biasedly considered reviews with lower ratings are more usefully than higher rating ones. Interestingly, the opposite pattern was observed in the city Phoenix, the median of the numbers of useful votes are higher for rating 3, 4, and 5 but lower for rating 1 and 2. Perhaps, restaurants with rating lower than 2 are avoided by people who use yelp. People are more willing to go to the highly rated restaurants and are more likely to have similar experience as other people who visited, so they think other users’ reviews are useful.
The Relationship Between the Numbers of Votes as ‘Funny’ and Votes as ‘Useful’ for Reviews, a Comparison of Three Cities in the US
As it shows in the plot, strong positive relationships are present between the numbers of votes as ‘funny’ and ‘useful’, indicating reviews that were voted for their funniness receive more votes for their usefulness as well. Especially in Pittsburgh, a lot more reviews are considered as both ‘funny’ and ‘useful’. In contrast, less reviews were voted in Charlotte. Three outliers are reviews only voted as ‘funny’ but not as ‘useful’. A few of outliers, majority of which are observations of Phoenix, are reviews only overwhelmingly voted for ‘useful’ but for ‘funny’. It is hard to draw conclusion that users in Pittsburgh have more sense of humors when they write reviews. But I observe that a lot more ‘funny’ votes in Pittsburgh than other two cities. It also could be because users in Pittsburgh tend to give more ‘funny’ votes than other two cities.

Latent Dirichlet allocation Model Visualization
Reviews are grouped into seven topics based on the words and their conditional distribution within a topics.
Topic 1 is categorized as service/overall experience for keywords: Food, Service, Place and Experience.
Topic 2 is categorized as value for food for keywords: Food, Price, Quality, and Portion.
Topic 3 is categorized as positive experience for keywords: Love, Highly Recommend, and Definitely.
Topic 4 is categorized as atmosphere for keywords: Place, Room, Spot, Pretty, Atmosphere, Music, and Patio.
Topic 5 is categorized as the overall experience for keywords: Dish, Menu, Experience, Service .
Topic 6 is categorized as food for keywords: Flavor, Dish, Cook, and Taste.
Topic 7 is categorized as value for overall experience for keywords: Food, Service, Place, Price, Quality.